Gina Peterson
Unite Us - Unite Colorado
Community Engagement

The Colorado Equity Compass provides organizations and individuals with the data storytelling resources they need to improve health equity in their communities. For more information see our Data Storytelling Guide
The following 6 steps show how to bring data storytelling to life.
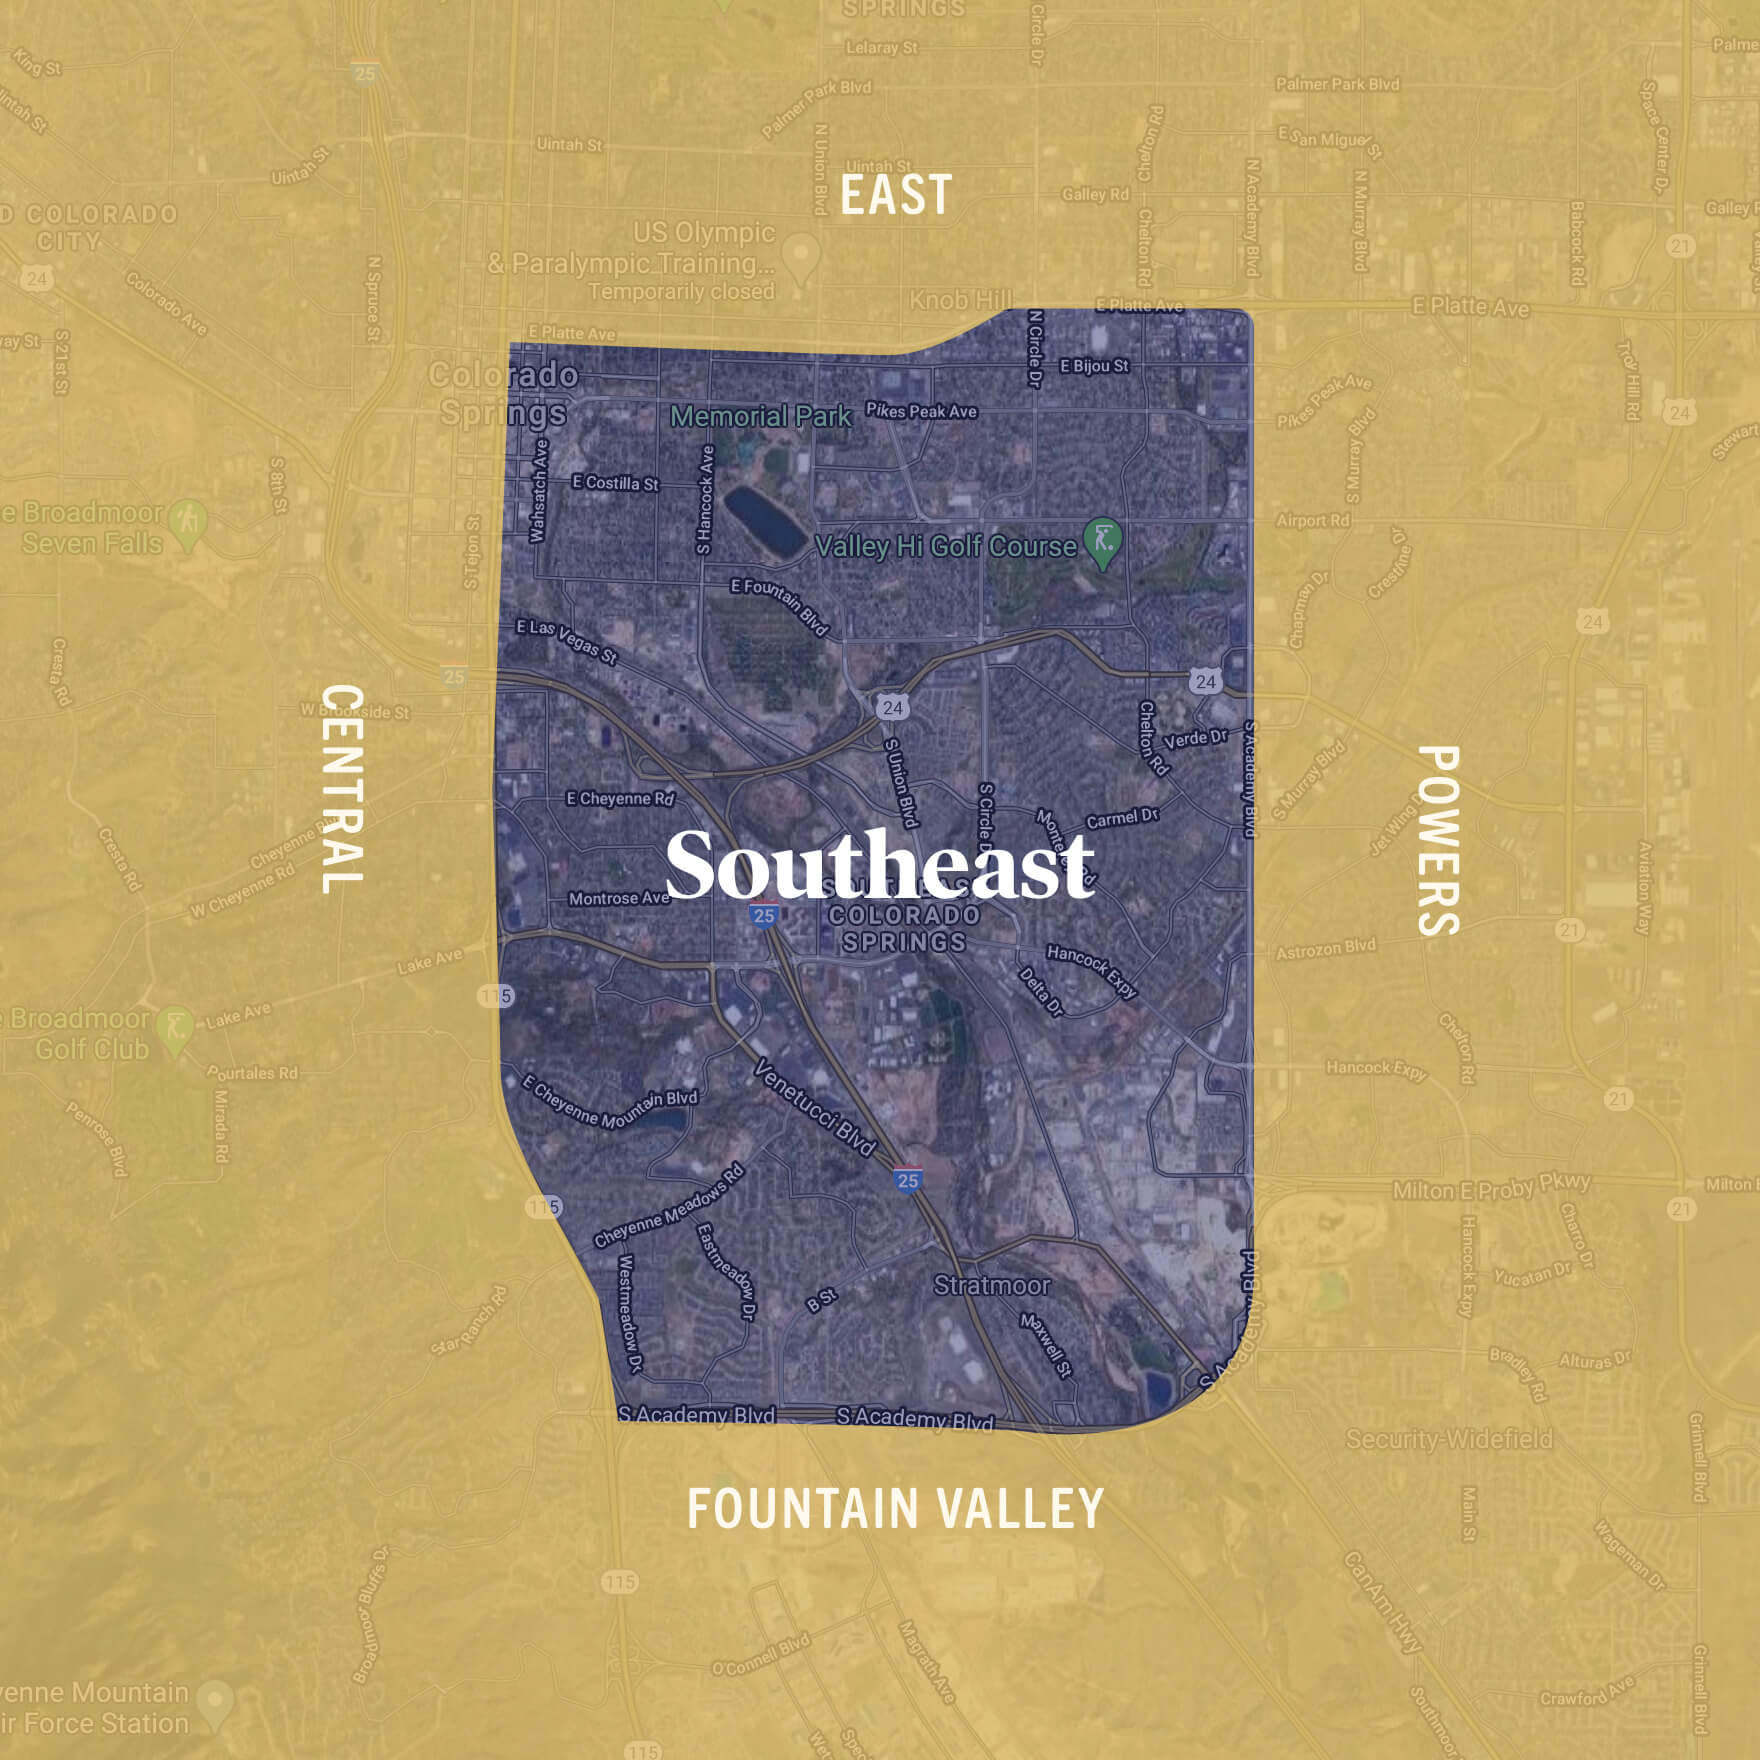
Home to some 73,697 people, Southeast Colorado Springs (considered zip codes: 80910 and 80916), if taken alone, would be Colorado’s 15th-largest city. A large portion of families living in Southeast Colorado Springs have been there for multiple generations, making the neighborhood an integral piece of people's’ identities.
Throughout the city, a negative perception of the Southeast has been developed—and the community is working to change this narrative. After years of disinvestment and under-representation, the community is advocating for the resources to transform into a thriving, healthy, and safe place to live.

Southeast is the portion of the city that faces challenges that the rest of Colorado Springs does not experience. There is poverty, disinvestment, and high crime rates to name a few, but over the last several years the community has begun to gain some momentum in addressing these disparities.
The project team originally set out to establish the connection between built environment and life expectancy. After VIP (very important people) meetings with their Southeast community, the project team decided to focus on accessibility as the main concern. This included looking at access to food (grocery stores) and access to healthcare services (hospitals and providers).
3. Existing Data
Since the community was interested in looking at access, using maps to display and understand the data was crucial. Maps existed that could show the distance to grocery stores and healthcare providers. The community also had access to multiple reports and data for El Paso County and the City of Colorado Springs, which included: Live Stories for Colorado Springs, El Paso County Public Health Scorecards , and the Urban Land Institute report. However, limited data specific to Southeast was available. In July 2020, the team reviewed the El Paso County Public Health website that showed the Southeast zip codes were having some of the highest rates of confirmed COVID-19 cases.
4. Data Gaps
Southeast quickly identified the need to collect additional data from Southeast community residents and reach out to existing partners in the community which included: Downtown Partnership and Greater Downtown Colorado Springs Business Improvement District (BID), Council of Neighbors and Organizations, and Youth Council. The Youth Council was employed to conduct resident interviews asking questions such as: do you feel safe where you live, how often do you ride a bike, is it easy to get healthy foods, etc. The pilot team also worked with Shift Research Lab to collect data for the health outcomes: life expectancy, low birth weight, and obesity of adults and for the social determinants of health factors: health insurance, high school degree, and low food access.
5. Meaning of the Data
In reviewing the maps and data, the community realized that Southeast actually had more grocery store options than they originally thought. They had thought there were only two grocery stores (King Soopers and Safeway) in the two zip codes (serving 70,000 people). However, there were additional stores offering groceries and produce such as Walmart, Save-A-Lot, and La Luna Market. Upon digging deeper into the data, it was evident that the Southeast area is considered a food swamp in that this neighborhood has a higher density of fast food restaurants (25 in total) and dollar stores (7 in total). Additionally, the maps showed that there are no hospitals in the area, but only two community health centers and one primary care office. In adding the bus routes, it looks like some individuals would need to travel more than an hour by bus in order to access these health care offices.
6. Engaging Stories
In order to engage and share community stories, Southeast launched "Daily Dose 719," a documentary series made up of vlog episodes and live streams highlighting interviews with community residents and local business owners. The goal of ‘daily dose 719’ is to change the narrative of the misunderstood Southeast community. Each episode focuses on aspects of health equity affecting the community: housing, criminal justice, family and social support, to name a few.
7. Data Storytelling
To bring together Southeast’s data storytelling project, the community has created a data dashboard on Tableau in conjunction with Daily Dose 719. The next step for Southeast will be to create a website that brings together both the data and videos/stories. This information will then be used for advocacy and be presented to city council in order to appeal for more investment in the Southeast community.